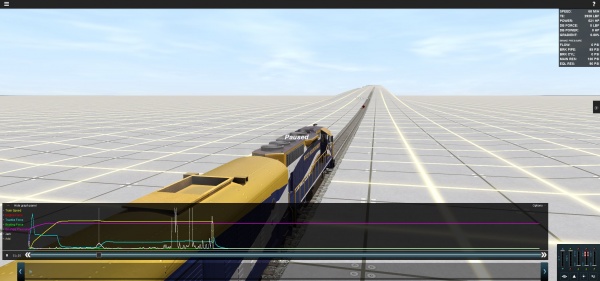
Test Track:Graph Panel
The graph panel is a powerful feedback mechanism that provides users with valuable data that can be used to evaluate a wide variety of performance characteristics.
Contents |
Adding Data Points
Values can be added by clicking +Add and selecting from the drop down list. Most variables are available per car. When the simulation is started, the data is drawn as lines on the graph against time.
Data Point Labels
Mousing over any of the data lines on the graph will show a tooltip indicating the data value and measurement scale.
Clicking on a data line will anchor the tooltip to the graph. Left-click and drag along the line to move the anchor-point, or drag off the line and release the mouse button to delete it.
Time Controls
The simulation runs at faster than real-world timing. The results are then stored in a "buffer" which can be played back from any position. This means that you can run a 30 minute test and jump to the 29 minute mark almost as soon as you start the test! You can click and drag the time slider or use the Forward and Back arrows to move in increments. The timer shows the time passed since the start of the test.
Note that as you move the time slider, the values also change in the HUD on the top right of the screen.
Graph Options
Save and Export Test Results
Clicking the Save test results provides the user with a choice of CSV report files which can be saved into a folder for detailed analysis of the data. Each report lists data collected at one second data intervals.
The default Train is the currently selected traincar. Click on the text to bring up a dropdown list of other report options. The "All" option consolidates reports for every car and consist into a single folder. Opening the reports in a program like Excel, then using copy/paste you can create summary reports with just the data you require. From there you can identify to the second when a specific characteristic began changing and analyse actual versus expected performance.
more to come...
